Detecting Data Drift with Evidently AI
Detecting data drift with Evidently AI is straightforward and essential for ensuring your model’s performance remains stable in production. Data drift occurs when the distribution of your model’s input data changes over time, potentially causing degraded performance if the model encounters data it was not trained to handle.
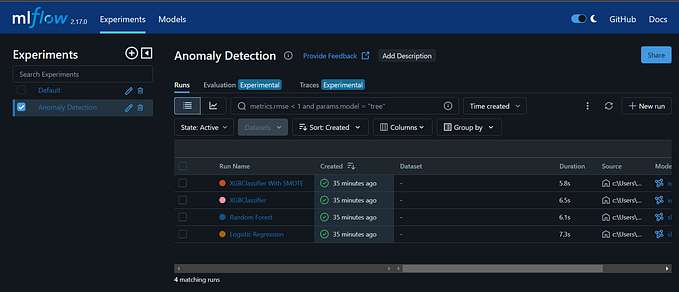
Usecases Evidently AI for model monitoring
Setting Up and Integrating with ML Pipelines
- Install Evidently: Install the Python package using
pip install evidently. - Integration: Integrate it within your existing machine learning pipeline, such as with MLflow. You can set up monitoring for your deployed model by tracking the model’s predictions over time.
- Data Requirements: Evidently requires historical data (reference data) and real-time (current) data to detect shifts.
Types of Monitoring Reports
Evidently AI offers various types of reports that cater to different monitoring needs:
- Data Drift: Identifies shifts in feature distributions over time. This is especially useful for cases where incoming data might not match training data distribution.
- Target Drift: Tracks the shift in the target variable, which can indicate changes in user behavior or system issues.
- Prediction Drift: Useful for monitoring shifts in model predictions, helping to detect when the model’s performance starts diverging.
- Performance Metrics: Monitors metrics like accuracy, F1-score, and AUC over time to track performance changes.
Implementing in a Production System
- Batch Monitoring: Schedule Evidently to process data periodically (daily, weekly, etc.), generating a report on model performance.
- Real-Time Monitoring: For real-time applications, Evidently can run in production to detect shifts in real time, alerting you of any significant issues.
- Alerts and Logging: You can set up alerts based on Evidently’s output, triggering a response (e.g., retraining the model or investigating data issues).
Visualizations and Reporting
- Interactive Dashboards: Evidently can generate interactive reports in Jupyter notebooks or HTML for easier visualization.
- Streamlit Integration: Since if you’re using Streamlit, you can integrate Evidently’s visualizations directly within your app to monitor model performance live.
Guide to Detect Data Drift with Evidently AI
We will develop drift detection for a ML model that predicting if the job description are related to toxic job. To apply drift detection for TinyBERT-based toxic job description classifier, we can monitor text data drift in two main areas:
- Embedding Drift: Compare distributions of embeddings over time. TinyBERT’s embeddings for job descriptions can be monitored for drift using similarity measures like Jensen-Shannon divergence, which captures changes in the text distribution.
- Prediction Drift: Track shifts in the model’s
is_toxicpredictions. Evidently AI can calculate metrics like chi-square tests to identify if the proportion of toxic predictions deviates from previous distributions, signaling a potential data drift. - Data Drift Detection: Evidently’s data drift detection assesses changes in the statistical properties of features extracted from text data. It compares distributions of keywords, phrases, or other features between reference and current datasets, detecting shifts in data distribution that may impact model performance. This helps identify covariate shift and ensures models remain robust to changes in data characteristics.
Evidently now supports raw text data as input. Previously, Evidently only worked with tabular data, expecting categorical or numerical features. It provides reports about different statistics of the model and the data.
Understanding the Data
Consider we have a dataset of toxic job descriptions. These descriptionshave the jobdescription_en column which is a textual feature containing the job description text and the is_toxic columns has the associated toxic category which a particular job belongs to.
Install Evidently AI
pip install evidentlyColumn Mappings
Column mappings refer to the process of associating columns in your dataset with specific features or variables they represent. It’s essential for Evidently to understand which columns correspond to inputs, outputs, or other relevant attributes to generate accurate insights and visualisations.
Defining the Column Mappings:
column_mapping = ColumnMapping(
    target= 'is_toxic' ,
    text_features=[ 'jobdescription_en' ]
)
Understanding the Data Drift Report
- Drift Detection Summary: Evidently AI provides a drift detection summary, which includes a drift score per feature and an overall drift metric.
- Feature-Specific Visuals: Each feature’s distribution is compared across
reference_dataandcurrent_data, displaying histograms, density plots, or other relevant visuals. - Threshold for Drift: The drift threshold (default: 0.5) helps decide if a feature has significant drift. You can adjust this threshold based on your needs.
Data Drift Preset
In Evidently, a Data Drift Preset for text data is a predefined configuration that simplifies drift detection for textual features between datasets. It includes default statistical tests and metrics, optimized to assess shifts in text distributions — like word frequencies and document similarities — helping to identify meaningful changes in text data over time. This preset streamlines setup for text-specific drift monitoring, making it easier to track and understand shifts in data that could affect model performance.
from evidently.metric_preset import DataDriftPreset
data_drift_report = Report(metrics=[
    DataDriftPreset(num_stattest= 'ks' , cat_stattest= 'psi' , num_stattest_threshold= 0.2 , cat_stattest_threshold= 0.2 ),
])

data_drift_report.run(reference_data=reference_data, current_data=current_data, column_mapping=column_mapping)
data_drift_report.show(mode= 'inline' )
Here is how the Data Drift report look like. Here we have run the data drift reports for comparing the jobs data with reference to the toxic. Based on the report we see there is a small drift seen in the data with value 0.5. However this is lees than the threshold defined.
Embedding Drift Detection
First, convert job descriptions to embeddings using TinyBERT. Calculate the average embedding per batch of descriptions for both reference (initial dataset) and current data.
from transformers import AutoTokenizer, AutoModel
import torch
import pandas as pd

# Load model and tokenizer
tokenizer = AutoTokenizer.from_pretrained("huawei-noah/TinyBERT_General_4L_312D")
model = AutoModel.from_pretrained("huawei-noah/TinyBERT_General_4L_312D")

# Function to get embeddings
def get_embedding(text):
    inputs = tokenizer(text, return_tensors="pt", max_length=512, truncation=True)
    outputs = model(**inputs)
    return outputs.last_hidden_state.mean(dim=1).detach().numpy()

# Example data loading and embedding calculation
reference_data = pd.read_csv('toxic_df_sample39.csv')
current_data = pd.read_csv('toxic_df_sample.csv')

# Calculate embeddings for each row and aggregate to track distribution
reference_embeddings = [get_embedding(text) for text in reference_data['jobdescription_en']]
current_embeddings = [get_embedding(text) for text in current_data['jobdescription_en']]
Using Evidently AI, calculate drift in embedding distributions:
import numpy as np
import pandas as pd

# Convert lists to numpy arrays and remove extra dimensions
reference_embeddings = np.array(reference_embeddings).squeeze()
current_embeddings = np.array(current_embeddings).squeeze()

# Create DataFrames with proper indexing
reference_embeddings_df = pd.DataFrame(reference_embeddings, index=reference_data.index[:reference_embeddings.shape[0]])
reference_embeddings_df.columns = ["embedding_" + str(i) for i in range(reference_embeddings_df.shape[1])]

current_embeddings_df = pd.DataFrame(current_embeddings, index=current_data.index[:current_embeddings.shape[0]])
current_embeddings_df.columns = ["embedding_" + str(i) for i in range(current_embeddings_df.shape[1])]

# Display the first few rows of both DataFrames
print(reference_embeddings_df.head())
print(current_embeddings_df.head())
from evidently import ColumnMapping
column_mapping = ColumnMapping(
    embeddings={'small_subset': reference_embeddings_df.columns[:10]}
)
Generate and Visualize the Report
Run the report on your data to generate a detailed analysis of each feature’s drift, summary metrics, and visualizations.
from evidently.report import Report
from evidently.metrics import EmbeddingsDriftMetric
# Here we measure drift on the small subset between train and test imdb records
report = Report(metrics=[
    EmbeddingsDriftMetric('small_subset')
])

report.run(reference_data = reference_embeddings_df, current_data =  current_embeddings_df,
           column_mapping = column_mapping)
report
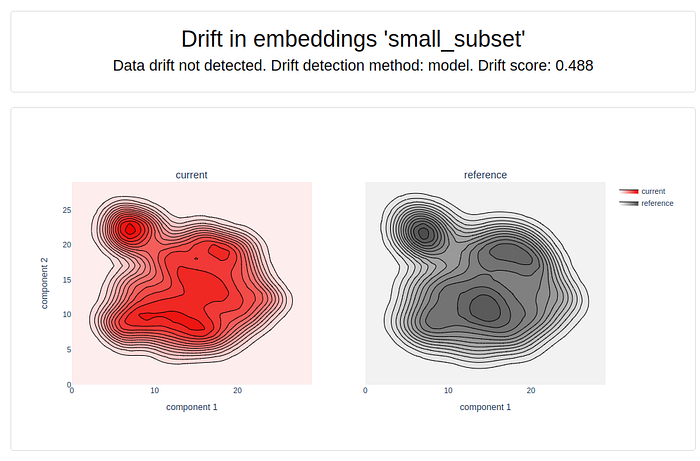
In the report above we can clearly see that there is not much deviation between the embeddings of current and reference set. However the drift score comes up to be 0.488 which can be due to the difference in the words/sentences used by different companies while having the same semantic meaning.
Automate and Integrate in Production
- Schedule Reports: You can automate the drift detection process, running it daily or weekly depending on your needs.
- Alerts: Set up alerts that notify you if a drift threshold is exceeded, triggering actions like retraining the model or analyzing data quality.
- Streamlit Dashboard: Since you use Streamlit, you could visualize the drift report directly in your Streamlit app:
# Save report
report.save_html("drift_report.html")
Schedule this script with a cron job (crontab -e):
0 0 * * 0 python /path/to/drift_detection.py # Runs weeklyAdd threshold checks to trigger alerts if drift exceeds limits:
drift_score = report.as_dict()["metrics"][0]["result"]["drift_score"]
if drift_score > 0.5:
    # Code to send an alert, e.g., via email or messaging
    print("ALERT: Data drift detected!")
In Streamlit, load and display the drift report:
import streamlit as st
from evidently.report import Report

# Load the saved drift report
with open("drift_report.html", "r") as file:
    report_html = file.read()

# Display in Streamlit
st.title("Data Drift Report")
st.components.v1.html(report_html, height=800, scrolling=True)If you liked the article, you can support the author by clapping below 👏🏻 Thanks for reading!